Graphs and Tables in Typst with Google Sheets
In my efforts to be independent of Microsoft and Google, I use Typst for typesetting documents. Whatever I use is independent of what other people typically use though. Transferring text from any old word processing software is easy enough, but making tables and graphs wasn't as easy to me at least. Here's a guide if you're new to all this, as I was.
1. Export your spreadsheet
From any spreadsheet software you should be able to download your document as a .CSV file. CSV(Comma-Separated Values) files are like primitive spreadsheets. While you have nicely formatted cells in Microsoft Excel, a CSV file is just data positioned via commas.
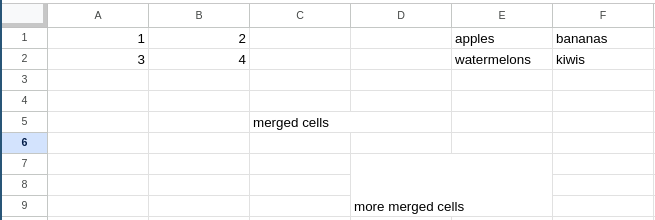
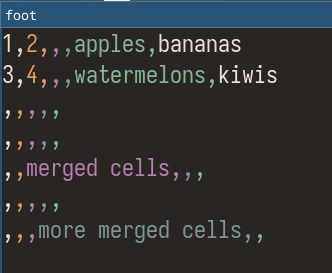
To read a CSV file, the "row" for an entry is by lines and the "column" is by commas. Cell E2 would be at line 2 and before the 5th comma.
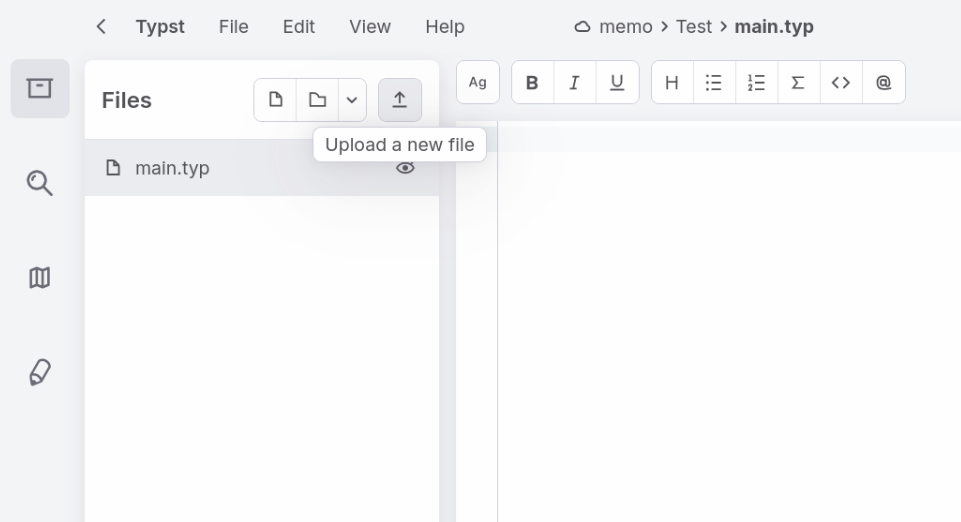
2. Import it into Typst